
We constantly write about releases and new features, but respected members and visitors would also be interesting to see the actual SAYMON tools use cases. Today we will tell you about one of these options, one of the scenarios, which can be useful for owners and key persons of the company.
Draw your business!
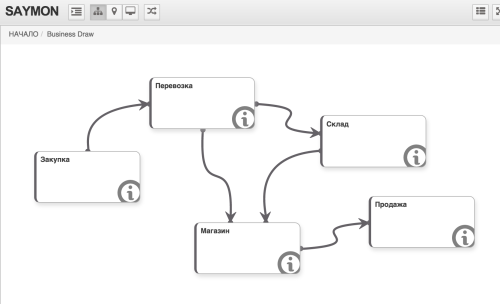
One way or another, sooner or later, but one of the owners or managers of the enterprise turns to the question of visual representation of the main structural parts of the company’s core and further detailed functional and business processes.
Our system provides tools to make an outline of process quickly and easy for any employee with the most basic knowledge of computer technology. To get started he or she needs Google Chrome and Internet connection only. In companies with local SAYMON setup, access to the Internet is not necessary.
Everything can work exactly like this: an executive forms a high-level diagram in the required level of abstraction and transparency perception; heads of departments detail their level of representation; subordinate employees draw carefully their part of the process with the right level of representation properties, details, comments and documents.
The first result is useful and important itself as a full transparency of business, the ability to identify critical areas, plan and carry out the necessary optimization.
Next step is to call up information technologies and automation. Each object and relation on the diagram can be measured and drawn in realtime. Metrics can be the result of a database query of accounting or management of individual business functions – SAYMON gathers rates of disparate subsystems and provide consolidation of specific metrics in a single system. Taking into account the trend of increasing availability of Internet communication and miniaturization of computing devices, you can control virtually every link in the chain of services or product workflow. Thus, managers at all levels get tool for analyzing the performance of the real structure at any given moment.
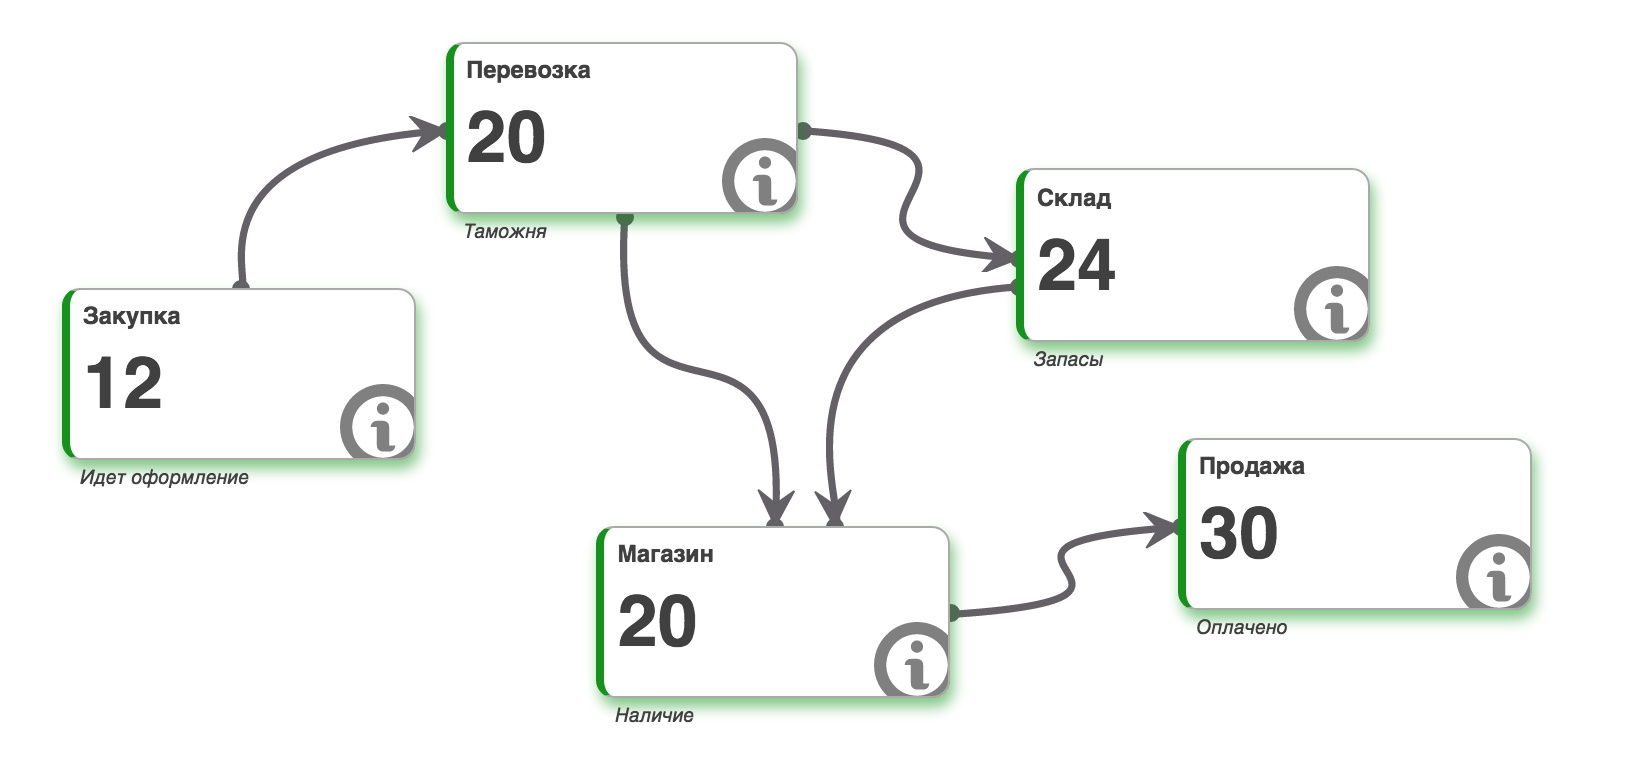
And even more! For each metric the corridor of normal values can be defined, which will automatically keep track of the normal behavior of the business in real time. In case of a fault the responsible employee is notified, which allows the quick response, minimizing downtimes and lost profits.
Historical metrics analysis is available today. You can conveniently analyze the behavior and mutual influence of indicators to determine the cyclical and seasonal behavior. We continue to develop SAYMON and plan to provide more correlation functions of the measured parameters, to improve the graphical representation formats, tabular representations and reports.
SAYMON – new stylish instrument inspired by Google’s products – easy, trendy, youth. SAYMON is the tool for the modern enterprise and management.